
Takaki Shimura1*, Hironori Ohsigi2
1BME Research Lab.,Sosei Ltd., Japan
2Josai International University, Japan
*Corresponding Author: Takaki Shimura, BME Research Lab.,Sosei Ltd., Japan.
Received Date: December 13, 2023
Accepted Date: December 19, 2023
Published Date: December 22, 2023
Citation: Takaki Shimura, Hironori Ohsigi. (2023) “A research study using CKPT on what kind of changes were brought about in the development process of the frontal lobe due to the national system change given to elementary school students (6-12 years old).”, Clinical Case Reports and Clinical Study, 10(1); DOI: 10.61148/2766-8614/JCCRCS/162
Copyright: © 2023 Takaki Shimura. This is an open access article distributed under the Creative Commons Attribution License, which permits unrestricted use, distribution, and reproduction in any medium, provided the original work is properly cited.
In August 1945, Japan's national system changed from an imperial system to democracy. We investigated the influence of Japanese people who faced this change during their elementary school years (6-12 years old), which is an important period in the growth process of frontal lobe function. The study was conducted using the CKPT (Japanese version of CWPT: Color Words Pick-out Test), which measures frontal lobe function, and examined whether the values of index 1 of the CKPT were normally distributed. Among males, the generation that faced the change showed a normal distribution similar to other generations, so it was assumed that the effect of the change during elementary school was not significant. On the other hand, among female, there was a generation that did not exhibit normality, not only among those who faced change during their elementary school days, but also among those who faced change before and after that time. Furthermore, it was found that the generations that did not show normality were related to the examined age group. This study shows that when people are faced with the most significant stimulus, the state system changing, during the growth process of their frontal lobe functions, it affects female more than male.
Introduction:
In August 1945, Japan's national system changed from an imperial system to democracy, forcing a change in the behavior of the Japanese people. The following considerations were made from the perspective that changes in national systems may affect the growth of cognitive function. In the imperial dictatorship system, the prefrontal cortex function, which allows people to make decisions and act on their own, was not allowed to activate, and subordinates from upper to lower were at the center of action in Japan. After the country was forced to change to democracy, the freedom of individual action that demonstrated the functions of the prefrontal cortex came to be respected. In other words, the norms of behavior have changed 180 degrees.
Japanese people who encountered the changes described above were shocked in their thinking process. I thought that this shock might have affected the development of the prefrontal cortex in elementary school students who were 6 to 12 year’s old, through previous many research 1-6). So, I conducted an investigation using the CKPT, which largely reflects the function of the prefrontal cortex7).
Methods
1. CKPT
CKPT (Japanese version of CWPT) was devised in 2003 as a test method that can classify cognitive function at PCSD(Preclinical Stage of Dementia)8)before the onset of dementia. For the first time in 2019, it was announced at an international conference9) that there is a correlation with WCST as criterion-related validity, sensitivity = 1, specificity = 0.963, and in the same year it was published as a paper in the HOSA Journal of Alzheimer's and Neurodegenerative Disease10). Furthermore, we presented a study that derived diagnostic criteria from large-scale data of 1325 people using CKPT at an international conference in 201911), and in 2020 we published the diagnostic criteria for CKPT in the same journal12). Since then, we has published research results such as the results of using CKPT on healthy elderly people13) and a report on comparing the normality of large-scale data over 15 years14).
The feature of CWPT is described following:
When a subject encounters color words (Fig.1) picked-out reading the story, he determines whether the meaning matches the printed color of the color word and picks-out as many color words as possible, by marking 〇 (match) and × (mismatch). One feature is a test that measures work ability and attention distribution ability, and the other feature is a test that measures memory ability of listening to questions (Fig.2) about the episodes written in the story without looking at the story after 2 minutes. The score of CWPT named Index1 is a product of them. In other words, it can be said to be a test that not only reflects the function of the frontal lobe, but also can comprehensively judge a person's cognitive function, including the ability to understand and execute complex test methods.
When MMSE15), CDR16), FAB17), etc., which are conventionally known as neuropsychological tests for dementia, are applied to people before MCI, the histograms of those scores are biased towards high scores (Fig. 3). On the other hand, the CKPT score (Index 1) shows a normal distribution, so a feature of this test is that it is possible to classify cognitive function using the mean value, mean value ± SD, and mean value ±1.5SD (Fig.4).
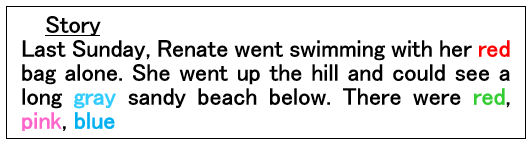
Fig.1 Sample of CWPT(Story)
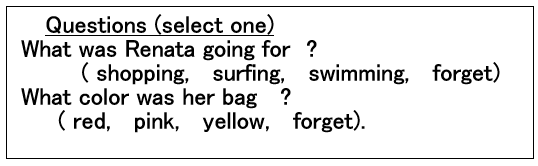
Fig.2 Sample of CWPT(Questions)
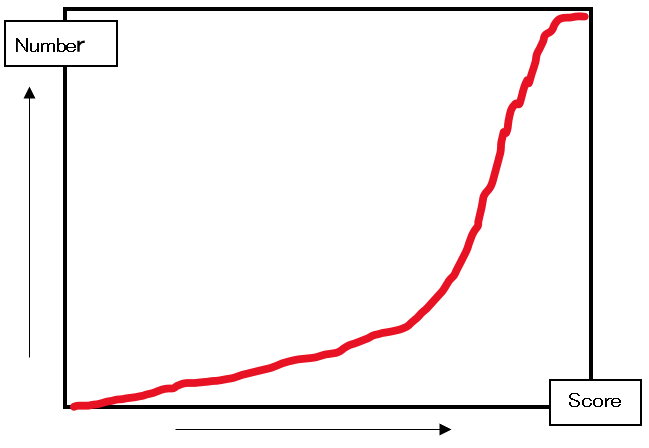
Fig.3 The histogram of MMSE, FAB, etc. before MCI
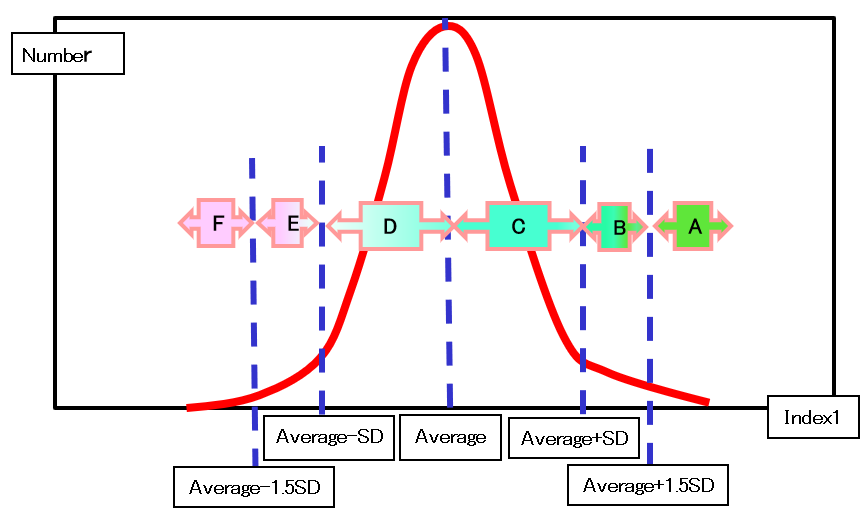
Fig.4 The histogram of CKPT before MCI
A:Excellent, B:Good, C and D:Normal, E:Slight disorder, F:Docter’s diagnosis is needed
2. Subjects
The large-scale data of 2555 subjects that had already been collected during about 10 years was divided into three groups shown on Table 1. They are B:1st to 6th grade elementary school age groups (6 to 11 years old), A:older age groups, and C:younger age groups on August 15, 1945. A comparative study will be conducted by age group. Table 1 shows the entire group. Table 2 shows the numbers of grouping subjects from large-scale data according to the rules in Table 1. The vertical items indicate the age when the test was taken for each gender, and the numbers indicate the number of subjects in each group.
Table1 Subjects grouping by age in 1945
|
Grouping |
A |
B |
C |
|
Condition in 1945 |
Elementary school graduate or above |
Elementary school grades 1-6 |
Before entering elementary school |
|
Age in 1945 |
12 years and older |
6-12 years old |
Under 5 years old or before birth |
|
year of birth |
before 1934 |
1935-1940 |
After 1941 |
2. Analysis
In past research, we divided large-scale data by gender and age and tested the histogram of each CKPT score (Index 1), and it was found that the results showed normality12). In this research, I decided to consider the same procedure for each group and taken ages on Table 2.
Table2 Subjects in each group
Total: 2557 subjects
|
Sex |
The age at which CKPT was taken |
A |
B |
C |
|
Male |
60s (60-69 years old) |
0 |
15 |
336 |
|
70s (70-79 years old) |
64 |
138 |
81 |
|
|
80s (80-89years old) |
67 |
5 |
0 |
|
|
Female |
60s (60-69 years old) |
0 |
64 |
816 |
|
70s (70-79 years old) |
193 |
394 |
234 |
|
|
80s (80-89years old) |
142 |
6 |
0 |
Results
Table 3 shows normality examination of CKPT Score using Shapiro-Wilk test. If significance p value is 0.05 or more, it follows normal distribution. If significance p value is less than 0.05, it is given a yellow line. It is found that every condition has normal distribution for male, but there are tree conditions which don’t have normal distribution. They are group A and 80’s, group B and 80’s, and group C and 80’s.
Table3 Normality examination of CKPT Score using Shapiro-Wilk test
If significance p value is 0.05 or more, it follows normal distribution.
If significance p value is less than 0.05, it is given a yellow line.
|
Conditions |
Statistics |
Degrees of freedom |
Significance probability p |
||
|
Male |
Group A |
70’s |
0.986 |
64 |
0.661 |
|
80’s |
0.973 |
67 |
0.158 |
||
|
Group B |
70’s |
0.974 |
15 |
0.916 |
|
|
80’s |
0.990 |
138 |
0.467 |
||
|
90’s |
0.952 |
5 |
0.751 |
||
|
Group C |
80’s |
0.992 |
336 |
0.063 |
|
|
90’s |
0.980 |
81 |
0.229 |
||
|
Female |
Group A |
70’s |
0.991 |
193 |
0.270 |
|
80’s |
0.980 |
142 |
0.036 |
||
|
Group B |
70’s |
0.978 |
64 |
0.296 |
|
|
80’s |
0.989 |
394 |
0.005 |
||
|
90’s |
0.865 |
6 |
0.208 |
||
|
Group C |
80’s |
0.995 |
816 |
0.007 |
|
|
90’s |
0.991 |
234 |
0.188 |
||
Considerations
Summerly
Previous studies have investigated the development of the frontal lobe from multiple angles, showing that it is most pronounced between the ages of 8 and 15, but we attempted to verify this using the CKPT, which strongly reflects the functions of the frontal lobe. Specifically, we assumed that development might be hindered by changes in Japan's national system. As shown in the results, men were not affected, but women became affected.
It is said that the frontal lobe continues to develop after the age of 8 to 15. This analysis shows that even if a large shock is given to children between the ages of 6 and 12, when their frontal lobes are still developing, they have the ability to overcome them.

Open Access By Aditum Open Access Journals id licensed under Creative Commons Attribution 4.0 International License. Based On a Work at aditum.org